When I joined the company, the website was doing its job — leads were coming in. The problem was visibility.
The company used multiple forms across the website: product-specific quote requests, general contact forms, and various layouts across different pages. Forms were being filled daily, but we couldn’t answer basic questions:
- Where did these leads come from?
- Which products were requested the most?
- Which regions generated demand?
- Which marketing channels actually worked?
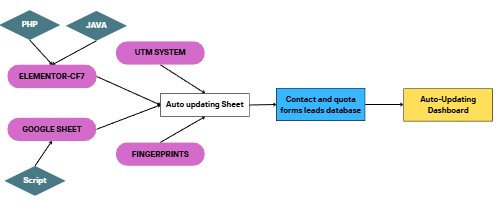
Step 1: Standardizing Attribution with a UTM System
The first step was introducing a consistent UTM framework across all marketing channels. Once UTMs were defined and enforced:
- Every campaign link carried attribution data
- UTM values were captured at form submission
- Source, medium, and campaign became part of every lead record
This turned anonymous submissions into traceable marketing outcomes.
Step 2: Centralizing Form Data Across the Website
Next, I focused on data unification. Using PHP and JavaScript, I built a system where:
- All website forms, regardless of type or page, sent submissions to a central Google Sheet
- Each submission followed the same data structure
- Product type, form type, and page context were preserved
For the first time, we had one source of truth for inbound leads.
Step 3: Enriching Leads with Behavioral & Technical Signals
To improve data quality and insight, we enriched each submission with:
- UTM parameters
- Behavioral and technical fingerprints (for quality assessment)
- Geographical indicators
- Page journey context prior to submission
This allowed us to distinguish high-intent leads from low-intent ones, identify real prospects versus suspicious submissions, and map regional demand patterns.
Step 4: Building a Visual Marketing Dashboard
Raw data is only valuable when it’s readable. I designed a visual marketing dashboard that showed:
- Lead volume by source and channel
- Geographic distribution of demand
- Most requested products
- Conversion trends by form type
- Channel performance over time
Instead of reacting to individual form emails, marketing and management could see the full picture at a glance.
The Impact
This system transformed how decisions were made:
- Marketing spend became data-driven
- Product demand trends became visible
- Sales prioritization improved
- Campaign performance could be evaluated objectively
Website forms stopped being “just forms” and became strategic sensors.
The Bigger Lesson
Web forms are not just lead capture tools. They are data collection endpoints.
When you unify attribution, enrich submissions, and visualize outcomes, inbound marketing stops being fragmented — and starts becoming a predictable growth engine.
Sometimes growth doesn’t come from more traffic. It comes from finally understanding the traffic you already have.